Carrier
CARRIER
Carrier -> Incoming
This option is dedicated to the traffic coming from your customers. There are various levels of detail that you can retrieve. The following diagram summarizes those levels:

⢠The first level shows by default a list of your customers and the traffic details for the previous hour.
⢠Click on any customer to enter the second level. Here you have information about the destinations for a specific customer. You can retrieve information for the last 24 hours and last 15 days for that Customer -> Destination.
⢠To go to the third level, click on a destination and you will see the list of carriers that deliver traffic to that destination. Or click on a dial code to see the carriers for that code. Here you have access the last 24 hours and last 15 days reports.
⢠To go to level four, click on any of the terminating carriers and you will retrieve the list of CDR for the previous hour. Note: Destination refers to the network where the call is intended to terminate. Now, if you want to access data of a specific trunk, expand using on a customer of Level 1 and follow the sequence shown in Figure 6.
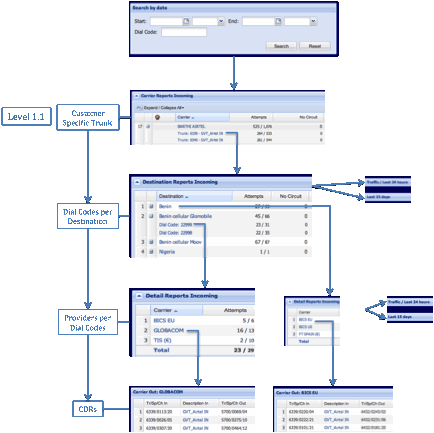
⢠Click on a trunk to see the list of destinations for that specific trunk.
⢠Select a destination, and you will have a list of providers for that network, or, expand the destination and you will have access to the dial codes available for that destination.
⢠Click on a dial code or destination to see the list of providers.
⢠Click on a provider to access the CDR.
Following is a detailed explanation of each table on the Carrier -> Incoming Window: ⢠Carrier Reports Incoming Traffic. ⢠Traffic Last 24 Hours. ⢠Last 15 Days. ⢠General Incoming Traffic â Last 15 days
Carrier Reports Incoming Traffic
The first Screen â Carrier Reports Incoming Figure 7- gives you general information about the traffic per customer for the previous hour. You can make use of the Search by Date window to retrieve data previously recorded.

By default you will see a list (Expand) of your customers sorted by traffic type. The traffic categories depend on the type of service rendered: hubbing, retail, etc. Click on Collapse all to show only the totals per type of traffic.
To customize the table, click on the right corner of any parameter and checkmark on the columns you want to see (Figure 8).

The complete list of parameters related to your traffic is shown in Appendix A.
Most COMPLETIONS data related with the quality and duration of the call is displayed in pairs separated by a forward slash (/). The value to the left of the slash represents the measurement of the previously recorded hour; the value to the right of the slash represents the average value in the same hour and same day for the last 8 weeks; this value helps determine the typical performance of the route. In some cases measurements are taken for one full day, for example when you make use of the Search By Date Window. In that situation, the value to the right of the slash represents the average value in the same day for the last 8 weeks. For new routes, the average values are calculated from the previous two days.
COMPLETIONS uses three colors to indicate an abnormal situation. To mark a parameter as abnormal, COMPLETIONSâ algorithm feeds itself with historical data and analyzes trends based on time of the day, day of the week, client, destination and provider. This algorithm prevents false positives.
Table 1. Events Color Codification COLOR CODE DESCRIPTION Red A red cell on the table indicates an abnormally low value in comparison to the typical performance of the route. Green A green cell indicates abnormally high values in comparison to the typical performance of the route. Yellow A yellow cell indicates a new source of traffic, for example a new route. It indicates that thereâs no previous data to determine typical performance for that route. This means that you are receiving new traffic not seen before. The symbol allows you to prioritize your customers according to the volume of traffic, the profit, or other criteria. There are three categories: gold, silver, and bronze. Figure 9 shows the screen of the Destination Reports. Here you can retrieve data for the last 24 hours or last 15 days for that specific network.

Figure 10 shows the list of carriers that terminate the traffic in the destination you chose. Again, data for the last 24 hours and last 15 days are available.

Figure 11 shows the CDR for that route. To customize the CDR table, click on the right corner of any parameter. In the window displayed you can sort data and select the parameters you want to see. See Appendix B for a description of the parameters in the CDR.

Traffic/Last 24 hours
The second table on the screen is the traffic for the last 24 hours (Figure 12). To retrieve data, click on the âload table button,â .
The table will show a summary per type of traffic for the last 24 hours (Figure 13). Three parameters are shown per hour: volume of traffic for that hour (MINUTES), ASR and ALOC. You can expand and collapse (Expand/Collapse All) all the data displayed or only the data of certain type of traffic ( and ).

From the table in Figure 13 you can retrieve detailed information as shown in Figure 14.
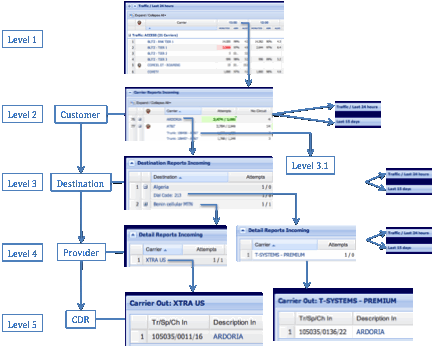
⢠Click on a specific hour of level 1 and you will retrieve the list of customers for that hour (Level 2 - Figure 14).
⢠Click on a specific customer and you will retrieve the list of destinations for that customer at the specified hour (level 3).
⢠Or click on a trunk assigned to a customer and you will see the destinations for that trunk (level 3.1). In this level the Last 15 Days table shows the traffic volumes for that customer in the prior two weeks for that specific hour.
⢠On level 3 you have two options: retrieve information for a destination or for a specific dial code.
⢠Then on level 4 you can see the list of carriers for that destination or code and on level 5, the CDR for the route.
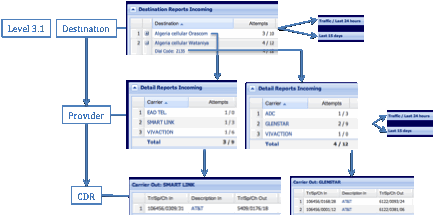
Now lets see level 3.1 (Figure 15) in detail: ⢠Once you have selected a specific hour, customer and trunk, you have two options: you can access a specific destination for that trunk or you can access a dial code.
⢠From there you can see the providers,
⢠And then the CDR.
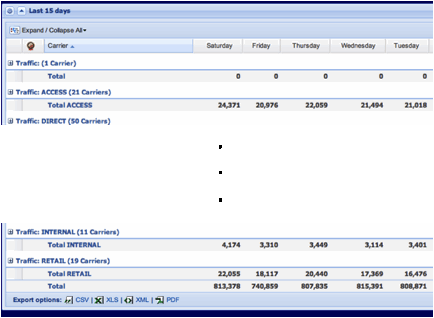
Last 15 Days
The third section of the Carrier -> Incoming screen is the Last 15 Days window (Figure 16). It provides traffic volumes (minutes) for the previous two weeks.
General Incoming Traffic â Last 15 days
The last section of the screen is the General Incoming Traffic â Last 15 days chart. It describes the behavior of your incoming traffic in terms of minutes per day.
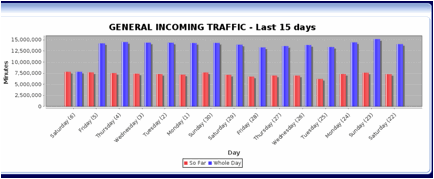
In this chart, the bars marked as âSo Farâ represent the daily traffic volume for the same amount of hours that has past in the present day. Scrolling the mouse over the bars shows the exact value. Note: All the tables can be exported using any of the following formats: csv, xls, xml, pdf. This option is always at the bottom of the table.
Carrier -> Outgoing
This section describes the traffic that you send to your providers. It has the same structure and functionality as the Carrier -> Incoming section shown in Figure 5. The following figure shows the level of detail in the Carrier -> Outgoing option:
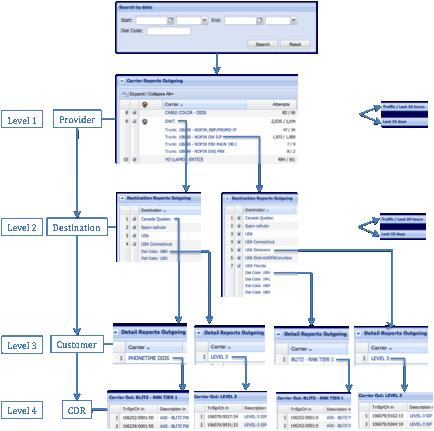
⢠The first level shows a list of providers and, by default, the traffic details for the previous hour.
⢠Click on any provider or trunk to enter the second level. Here you have information about the destinations of a specific provider or trunk. You can retrieve information for the last 24 hours and last 15 days for that Provider -> Destination.
⢠To go to the third level, click on a destination or dial code. You can see the list of customers sending traffic to that destination or dial code Here you have access to the last 24 hours and last 15 days reports.
⢠To go to level 4, click on any of the customers and you will retrieve the list of CDR for the previous hour.
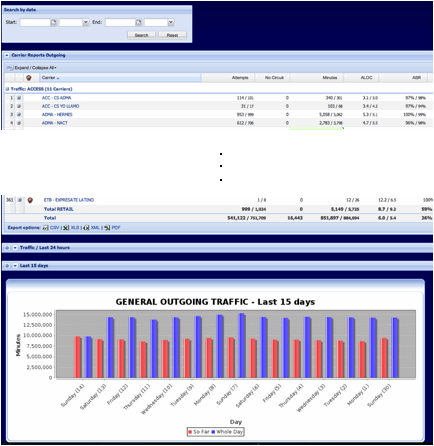
CARRIER LAST 15 MINS
In this option of the Main Menu Bar you can retrieve information about the Incoming and Outgoing traffic for the last 15 minutes (0:01 â 15:00, 15:01 â 30:00, 30:01 â 45:00, 45:01 â 0:00). It has the same structure and functionality as the Carrier -> Incoming or Outgoing option. Figure 20 represents the sequence of levels for the Carrier Last 15 Minutes -> Incoming option.

⢠When you open the Carrier Last 15 Minutes -> Incoming window, you see a complete list of customers (level 1), organized by type of service.
⢠Click on a customer to see the list of destinations (level 2) or click on to retrieve the list of trunks for a customer, and then select a trunk.
⢠Now to see the list of providers (level 3), click on a destination or click on and then select a dial code. ⢠The CDR (level 4) is displayed when you select a provider.

Figure 21 represents the sequence of levels for the Carrier Last 15 Minutes -> Outgoing option:
⢠First you will see a complete list of providers organized by type of service (level 1).
⢠Click on a provider to see the list of destinations (level 2) or click on to retrieve the list of trunks for that provider, and then select a trunk. ⢠Now to see the list of customers (level 3), click on a destination or click on to see the list of dial codes then select a dial code.
⢠The CDR (level 4) is displayed when you select a customer.