Difference between revisions of "Deviation"
| Line 6: | Line 6: | ||
In this screen you can locate specific changes in your incoming traffic behavior. You can narrow your search using the following options: | In this screen you can locate specific changes in your incoming traffic behavior. You can narrow your search using the following options: | ||
| − | + | * Top New Traffic: This option presents new traffic coming to your network, new routes or, customers that have started to send traffic. | |
| − | + | * Top Increase: Denotes an unusual increase of traffic on a destination or route compared to the typical ranges of the route. | |
| − | + | * Top Decrease: Shows the abnormally low values of traffic of a route compared to its typical performance. | |
| − | + | * All Traffic: Compiles all the events of your routes. | |
Latest revision as of 19:15, 1 June 2015
This functionality is very useful to locate potential problems or unusual behavior of your traffic in the previous hour (by default). The Events Color Codification of Table 1 is used to denote such cases.
Deviation -> Incoming
In this screen you can locate specific changes in your incoming traffic behavior. You can narrow your search using the following options:
- Top New Traffic: This option presents new traffic coming to your network, new routes or, customers that have started to send traffic.
- Top Increase: Denotes an unusual increase of traffic on a destination or route compared to the typical ranges of the route.
- Top Decrease: Shows the abnormally low values of traffic of a route compared to its typical performance.
- All Traffic: Compiles all the events of your routes.
You can also narrow your search for a specific timeframe by using the Search by Date Window.

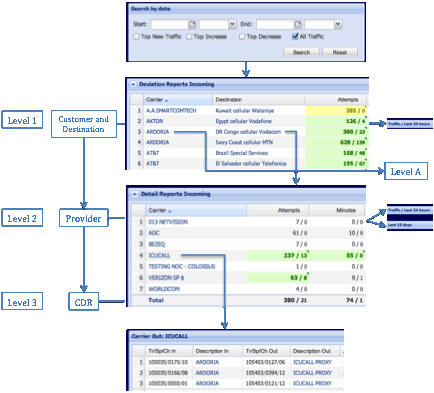
⢠Once you go to Deviation -> Incoming, your screen will show you a complete list of events sorted by customer (level 1).
⢠Click on a destination and you will have a list of providers for that destination.
⢠In this level you can locate the provider that shows unusual values (level 2).
⢠In level 3 you have the CDR for that route.

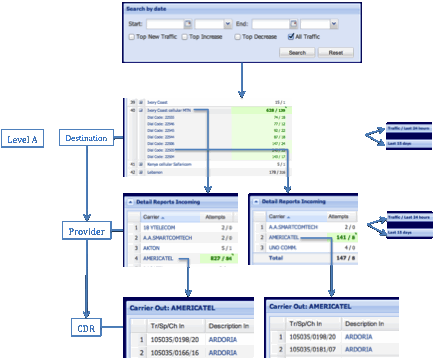
⢠Now, to enter level A click on a carrier. You will see a complete list of destinations for that carrier.
⢠Here you have two options: you can see the performance of one destination or the performance of a specific Dial Code.
⢠In the next level you can determine the provider that is showing unusual values of traffic.
Deviation -> Outgoing
This section describes the unusual events in your outgoing traffic. It has a similar structure as Deviation -> Incoming.

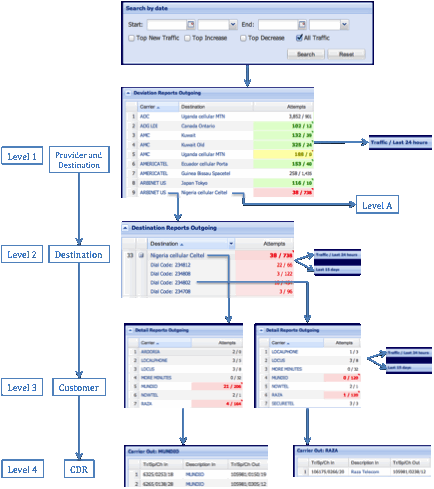
⢠In level 1 you have the list of providers and destinations that show an unusual behavior.
⢠If you click on one of them you will see a complete list of destinations for that carrier (level 2).
⢠You can click on a destination or you can expand it to access a list of dial codes and then select one (level 3).
⢠In level 4, you have the CDR for each case.

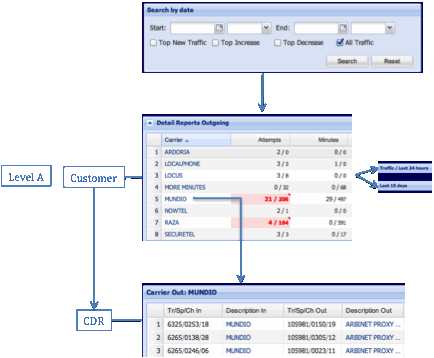
Now, in level 1 if you click on a destination (level A) you will retrieve a list of customers for that destination and then, the CDR.