Difference between revisions of "Custom"
(Created page with "'''CUSTOM''' With this option you have the possibility to retrieve information about the traffic performance of incoming or outgoing carriers and/or destination. '''Custom...") |
|||
| (4 intermediate revisions by the same user not shown) | |||
| Line 1: | Line 1: | ||
| − | |||
| − | |||
| − | |||
With this option you have the possibility to retrieve information about the traffic performance of incoming or outgoing carriers and/or destination. | With this option you have the possibility to retrieve information about the traffic performance of incoming or outgoing carriers and/or destination. | ||
| Line 9: | Line 6: | ||
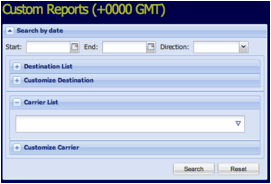
With the Custom Reports (Figure 34) you can load data related to the traffic performance of your routes. | With the Custom Reports (Figure 34) you can load data related to the traffic performance of your routes. | ||
| − | <center>[[Image:]]</center> | + | <center>[[Image:Figure34.gif]]</center> |
| − | <center>Figure 34. Custom Reports Window.</center> | + | <center>''Figure 34. Custom Reports Window.''</center> |
| Line 23: | Line 20: | ||
| − | <center>[[Image:]]</center> | + | <center>[[Image:Figure35.gif]]</center> |
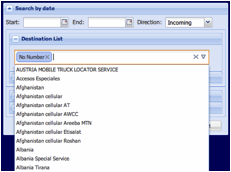
| − | <center>Figure 35. Destination List Search in the Custom Reports Window.</center> | + | <center>''Figure 35. Destination List Search in the Custom Reports Window.''</center> |
| Line 32: | Line 29: | ||
| − | <center>[[Image:]]</center> | + | <center>[[Image:Figure36.gif]]</center> |
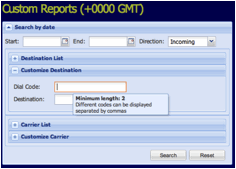
| − | <center>Figure 36. Customize Destination â Dial Code in the Custom Reports Windows</center> | + | <center>''Figure 36. Customize Destination â Dial Code in the Custom Reports Windows''</center> |
| Line 41: | Line 38: | ||
| − | <center>[[Image:]]</center> | + | <center>[[Image:Figure37.gif]]</center> |
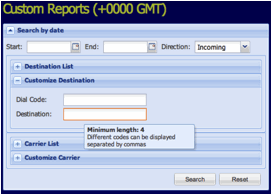
| − | <center>Figure 37. Customize Destination â Destination in the Custom Reports Window.</center> | + | <center>''Figure 37. Customize Destination â Destination in the Custom Reports Window.''</center> |
| Line 50: | Line 47: | ||
| − | <center>[[Image:]]</center> | + | <center>[[Image:Figure38.gif]]</center> |
| − | <center>Figure 38. Carrier List in the Custom Reports Window.</center> | + | <center>''Figure 38. Carrier List in the Custom Reports Window.''</center> |
| − | <center>[[Image:]]</center> | + | <center>[[Image:Figure39.gif]]</center> |
| − | <center>Figure 39. Detailed Carrier List in the Custom Reports Windows.</center> | + | <center>''Figure 39. Detailed Carrier List in the Custom Reports Windows.''</center> |
| Line 65: | Line 62: | ||
| − | <center>[[Image:]]</center> | + | <center>[[Image:Figure40.gif]]</center> |
| − | <center>Figure 40. Customize Carrier in the Custom Reports Window.</center> | + | <center>''Figure 40. Customize Carrier in the Custom Reports Window.''</center> |
| Line 74: | Line 71: | ||
| − | <center>[[Image:]]</center> | + | <center>[[Image:Figure41.gif]]</center> |
| − | <center>Figure 41. Example of a Report.</center> | + | <center>''Figure 41. Example of a Report.''</center> |
| Line 83: | Line 80: | ||
| − | <center>[[Image:]]</center> | + | <center>[[Image:Figure42.gif]]</center> |
| − | <center>Figure 42. Line chart for Traffic Stats in the Custom Report Window.</center> | + | <center>''Figure 42. Line chart for Traffic Stats in the Custom Report Window.''</center> |
| Line 94: | Line 91: | ||
| − | <center>[[Image:]]</center> | + | <center>[[Image:Figure43.gif]]</center> |
| − | <center>Figure 43. Custom Graph Window.</center> | + | <center>''Figure 43. Custom Graph Window.''</center> |
| Line 103: | Line 100: | ||
| − | <center>[[Image:]]</center> | + | <center>[[Image:Figure44 1.gif]]</center> |
| + | |||
| + | |||
| + | <center>[[Image:Figure44 2.gif]]</center> | ||
| − | <center>Figure 44. Example of a Custom Graph.</center> | + | <center>''Figure 44. Example of a Custom Graph.''</center> |
| − | + | The graph generated shows the stats values for each hour of the timeframe specified in the Search by Date fields. | |
Latest revision as of 13:02, 30 July 2013
With this option you have the possibility to retrieve information about the traffic performance of incoming or outgoing carriers and/or destination.
Custom -> Custom Reports
With the Custom Reports (Figure 34) you can load data related to the traffic performance of your routes.
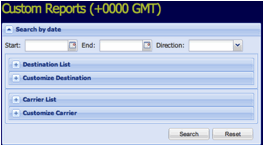
You can customize your search as follows:
⢠Start and End: Use these fields to recall stats information for a specific timeframe. Note that the reference time is +0000 GMT. Data for the current day is not available.
⢠Direction Here you choose between incoming and outgoing traffic.
⢠Destination List: A complete list of your destinations is displayed. You can choose more than one destination (Figure 35).
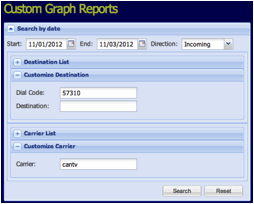
⢠Customize Destination: If you donât want to use the Destination List, you can customize your report by Dial Code and/or Destination. In the Dial Code field you must enter at least two digits of the destinations you want to the data to be retrieved. The codes must be separated by commas (Figure 36.)
In the Destination field, you can type the country, city or operator name -for example âComcelâ. You must type at least the first four letters and separate different destinations by a comma (Figure 37).
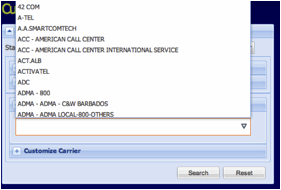
⢠Carrier List: In this field you can look for a specific carrier in the list and add multiple carriers to your search (Figures 38 and 39).
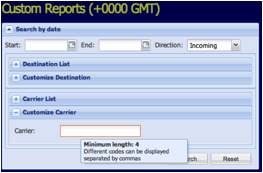
⢠Customize Carrier: You can type the name of the carrier directly in the field carrier and separate them by commas when you type multiple carriers.
Now letâs take a look at the report. Figure 41 is an example of the list of customers sending traffic to Dial Codes 57310 and 576, between November 1st and 4th. The report shows the subtotals per customer and a grand total at the bottom of the table.
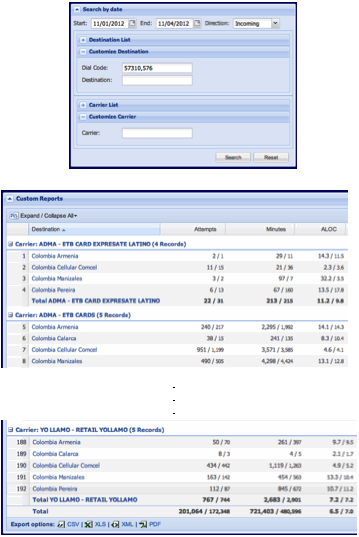
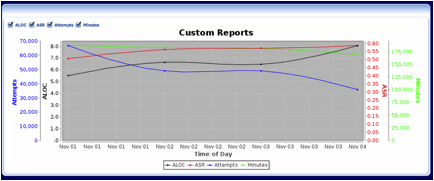
At the bottom of the window you will see the stats variation over the actual timeframe (Figure 42).
Custom -> Custom Graph
With the Custom Graph Window (Figure 43) you can generate a line graph that displays the traffic performance of a specific route.
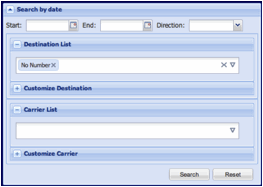
This window has the same structure as the Custom Reports window.
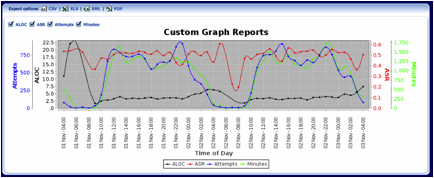
The graph generated shows the stats values for each hour of the timeframe specified in the Search by Date fields.